Plots
| Figure 1 | Figure 2 | Figure 3 | Figure 4 |
 |  |  |  |
| Aggregated metric results over all datasets. | Twelve spatial quality and temporal stability metrics evaluated for 9 DR methods run on ten datasets. Note that here we've added the results of convolutional methods to the analysis. | Detailed analysis of distances and movements produced by all DR techniques on the cartolastd dataset. | Examples of instability in TF-t-SNE (a,b) and TF-PCA (c,d,e). |
| Figure 5 (UMAP) | Figure 5 (t-SNE) | Table 3 supplement |
 |  | 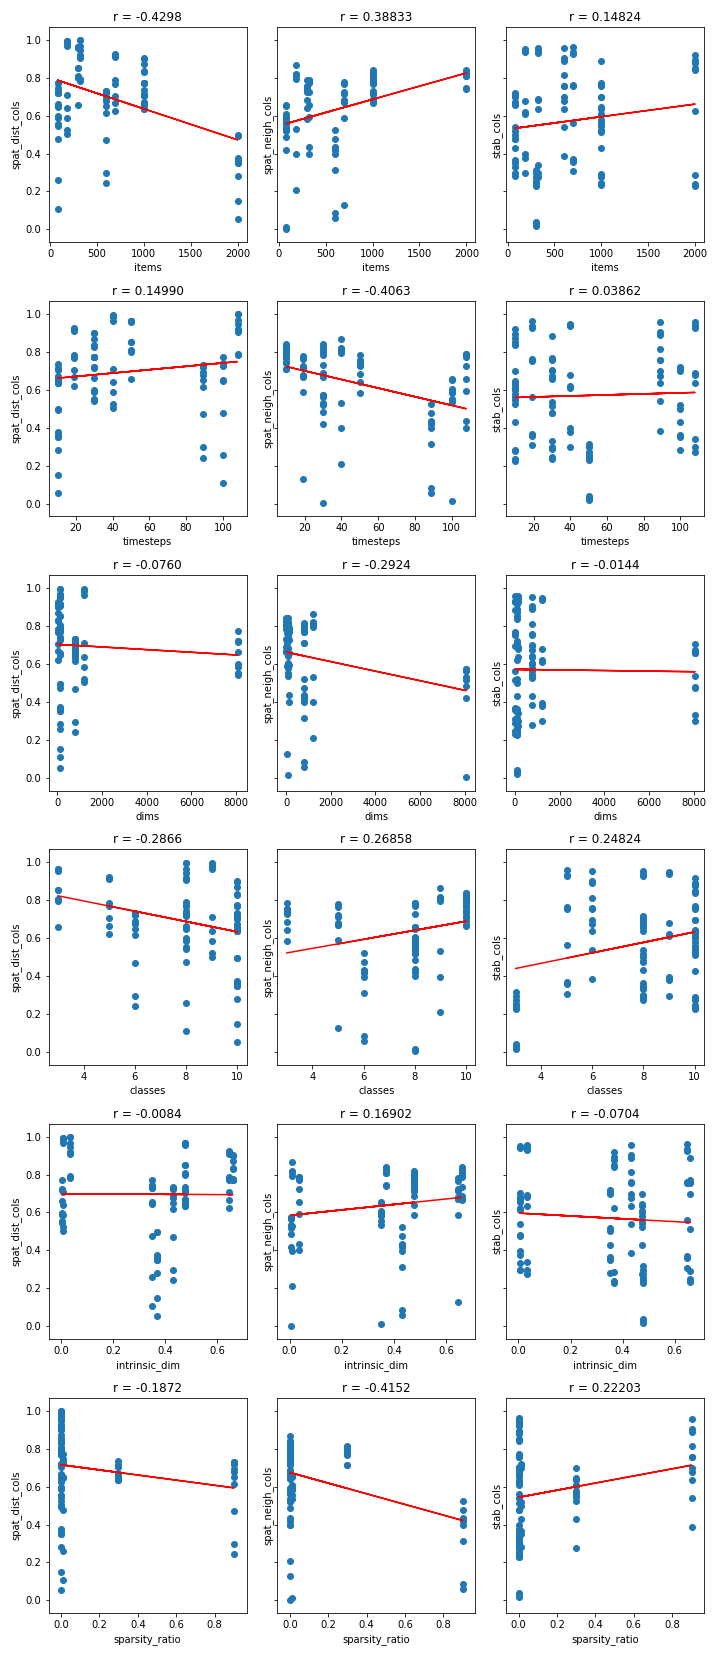 |
| UMAP projection of projections map showing the similarity of all evaluated techniques on all datasets (Sec. 5.2). Note that here we've added the results of convolutional methods to the analysis. | Alternative version of figure 5 where the projection method is t-SNE instead of UMAP. | Scatter plot showing correlation between traits and quality metrics (complement of Table 3). |